
Sales data analysis helps businesses grow in 5 key ways: improved retention (70% success rate selling to existing customers vs. 5-20% for new), better forecasting, accurate value propositions, stronger pipeline management, and targeted marketing. Data-driven businesses are 58% more likely to hit revenue goals.
Last Refreshed: March 2026 with updated statistics and tool information.
Sales data analysis is the process of collecting, interpreting, and acting on measurable information from your sales cycle — including demographic, technographic, chronographic, and intent data — to make data-driven decisions that accelerate revenue growth. You’ve probably heard “the money is in the data” many times. As technology advances, that statement grows more urgent.
From Daniel Conn, GTM Strategist, graph8: “Most B2B teams think their data problem is volume — not enough contacts in the funnel. The real problem is almost always quality. A smaller list of accurately enriched, signal-verified accounts will out-convert a massive stale database every time.”
Businesses looking to gain customers and close sales are integrating software like CRMs into their sales cycle to collect this data. Statistics show that data-driven businesses are 58% more likely to reach their revenue goals than those that do not use data.
But how do you ensure your business benefits from sales data?
After collection, the next crucial step is understanding how to analyze sales data. Through sales data analytics, you can interpret the data and turn it into actionable insights that — when well-implemented — lead to measurable business growth. CIENCE has worked with 2,500+ clients across 250+ industries, and the teams with the strongest pipeline growth almost always share one trait: they let data, not instinct, drive targeting decisions.
What Is Sales Data?
Sales data is measurable information collected during a sales process. You can use this information to guide each sales rep and make data-driven decisions — ranging from prospecting strategy and sales automation to pipeline prioritization and revenue forecasting. Solutions developed from sales data analysis help strengthen your pipeline and align sales goals across the team.
There are different sales data categories. Here are the most crucial ones for B2B:
- Demographic data. The most basic category — company maturity stage, location, and number of employees.
- Technographic data. Reveals the technology your prospects use day-to-day. If a company is missing a tool you provide, that’s a live sales opportunity.
- Chronographic data. Shows business changes that create new prospects or revive cold leads — funding rounds, acquisitions, IPOs, leadership changes.
- Intent data. Reveals your prospects’ online behavior, making it easier to identify purchase interest. First-party data comes from your own website; third-party data is aggregated across the web.
Understanding which data type to apply at each stage is the difference between a reactive pipeline and a proactive one. Intent data reveals historical patterns; demographic data identifies new ideal targets.
5 Ways Sales Data Analysis Helps Business Growth
Now that we’ve covered what sales data is, here are five concrete ways analysis turns that raw data into revenue. We’ll also look at how you can use B2B data solutions and data-driven sales strategies to increase your revenue and profit margin.
1. Improved retention rates
Even when pursuing new customers, your highest-probability sales opportunity sits with your existing book of business. The success rate of selling to existing customers is around 70%, but only 5% to 20% for a new customer.
Sales analytics makes this actionable by helping you identify what your top customers value, flag early churn signals, and improve customer experience. For instance, analysis might reveal that poorly timed or overly generic email outreach is driving churn — a fixable problem once you can see the pattern. With that intel, your team can use discounts, timed free trials, and personalized outreach to retain at-risk accounts.
Effective sales data analysis also surfaces upsell and cross-sell opportunities through customers’ usage patterns and purchase history. These tactics retain customers by delivering more value from your existing products and turn one-time buyers into repeat customers through targeted recommendations and programmatic ads.
2. Better forecasting
Forecasting is using historical and current data to project future outcomes — specifically, what your pipeline will produce and when. Through sales forecasting, you can prepare for risks, allocate resources accurately, and hold your team accountable to realistic targets.
For instance, projecting quarterly revenue makes it easier to staff your sales team correctly and set achievable quotas. The more accurate your forecast, the more confidently your leadership can plan headcount, marketing spend, and product investment.
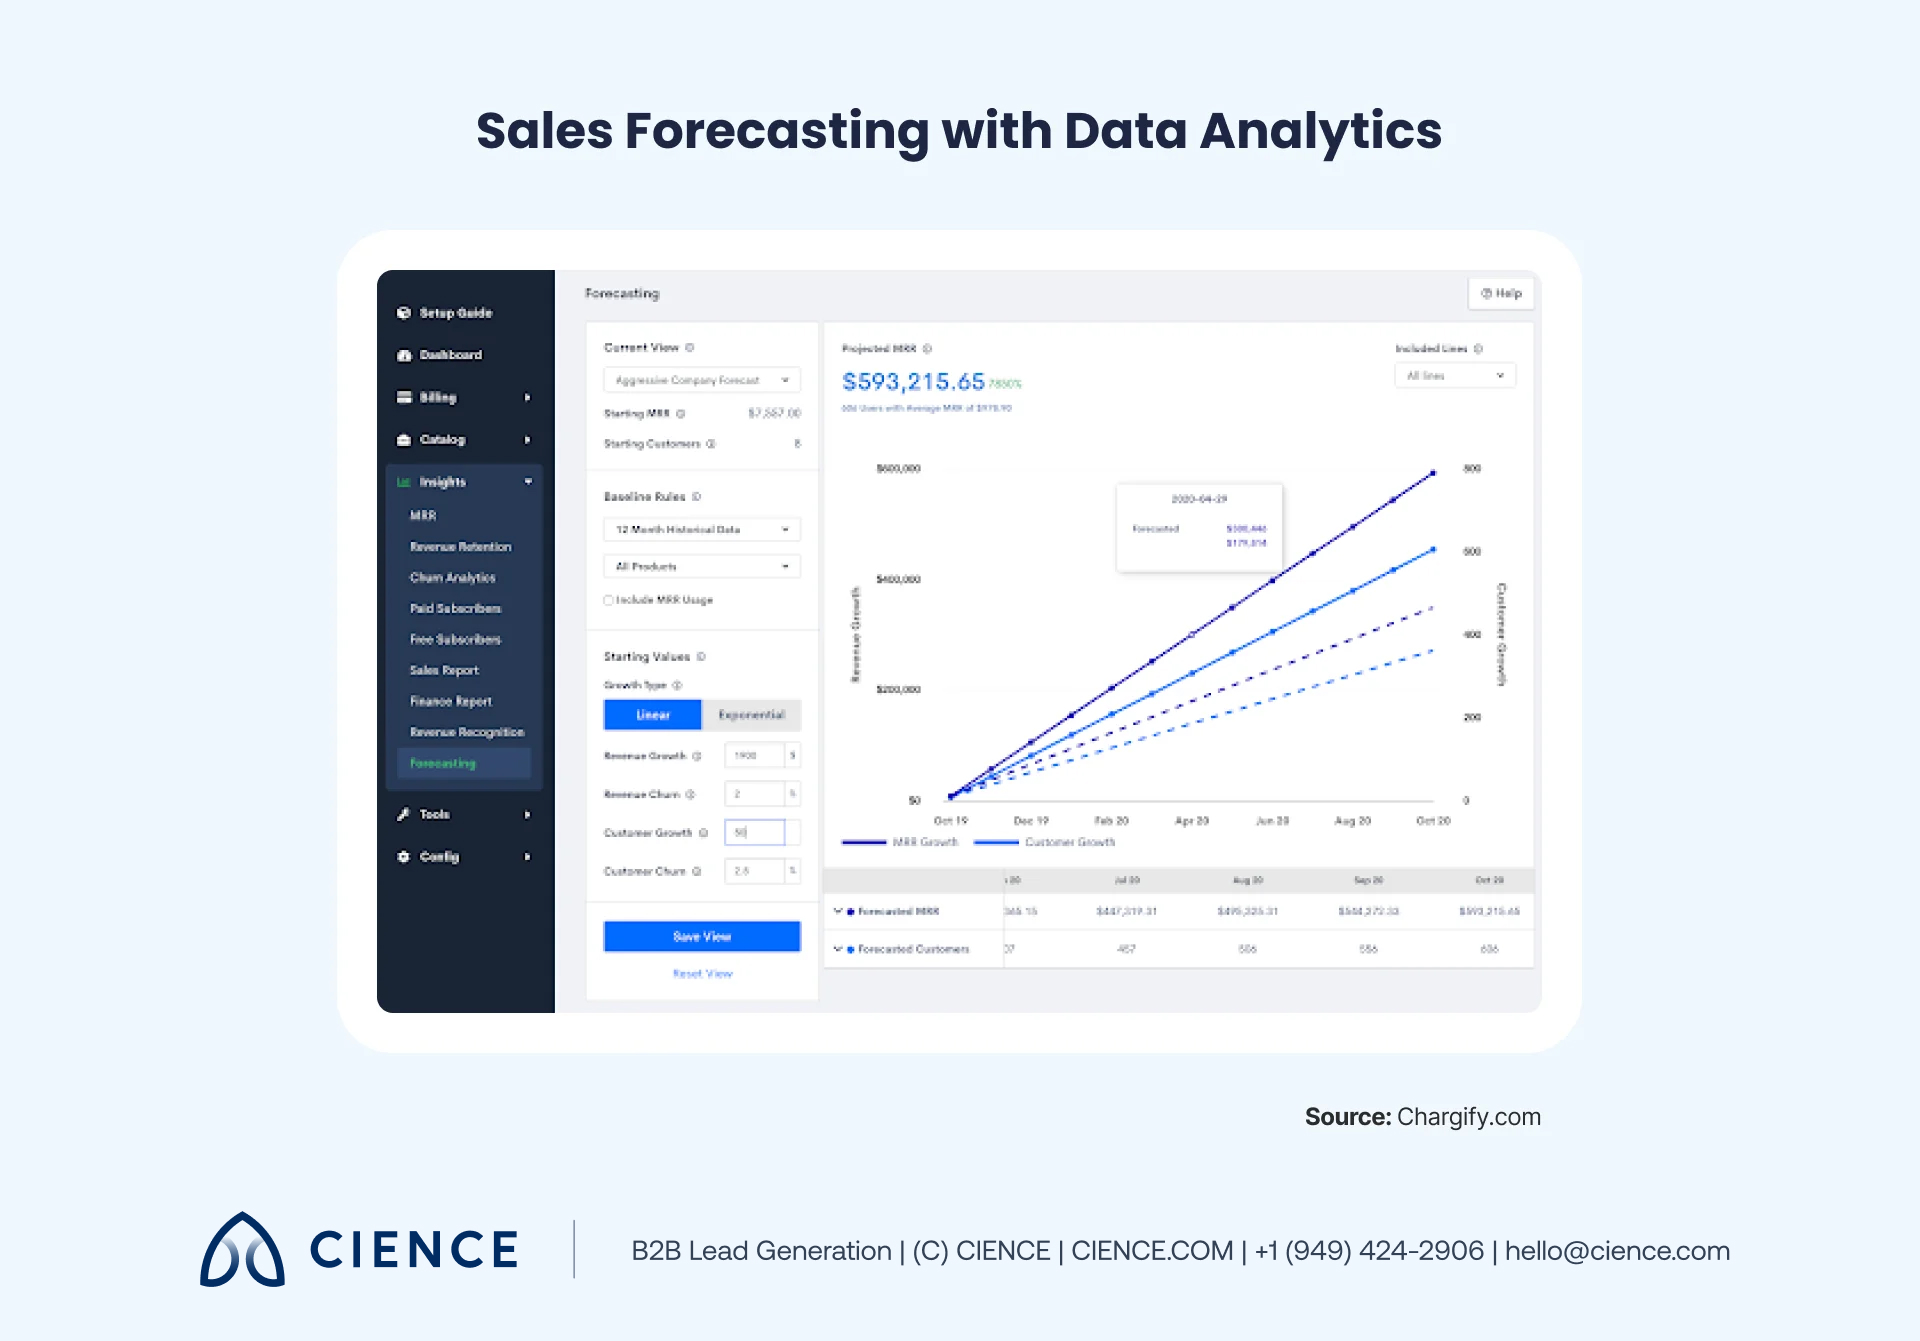
Your forecast is only as good as the data behind it. Pay close attention to sales data quality — higher quality data produces tighter, more reliable projections. There are three main forecasting techniques:
- Qualitative model. Analyzes past sales operations data to predict future demand. Useful for estimating product volume or territory potential.
- Time series model. Focuses on specific sales patterns and seasonal changes to predict future outcomes.
- Causal model. Makes predictions by weighing external variables — GDP, population growth, market conditions — that influence demand.
Most accurate forecasts combine all three approaches. The technique you lead with depends on the stage of the sales cycle you’re forecasting and the data you have available.
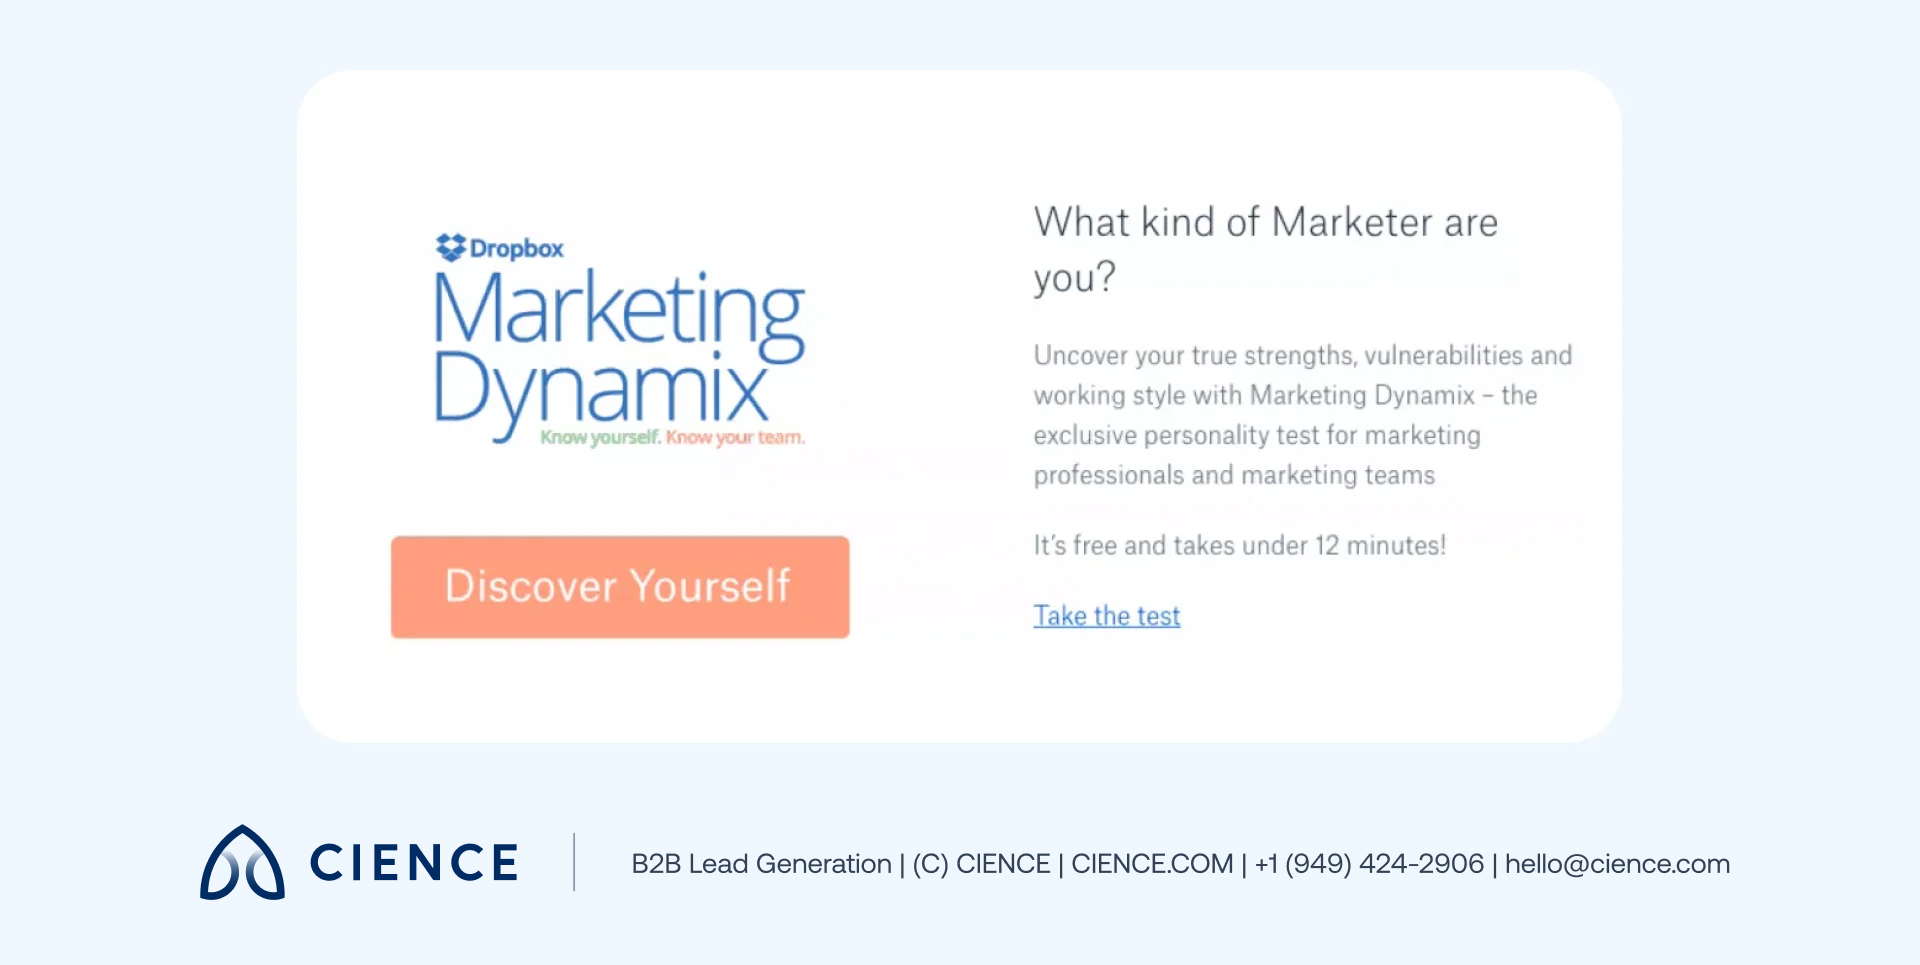
3. Accurate value propositions
Your value proposition only works if it reflects what customers actually want. Data makes that possible. By analyzing what your top customers have in common, what objections stall deals, and what outcomes they’re trying to achieve, you can sharpen your positioning to be specific — not generic.
Value propositions should cover three elements:
- The promise of what you will deliver
- What customers gain by choosing your business
- Why they should choose you over competitors
Your value proposition should compel prospects to act. The example above — a promise to acquire more clients — works because it’s outcome-specific, not feature-focused. Pair your value proposition with supporting statistics and client results to build credibility and B2B customer loyalty over time.
4. Stronger pipeline management
Pipeline management matters most when your leads list is growing faster than your capacity to work them. Without data-driven prioritization, you end up chasing low-fit leads while your best opportunities stall.
Quality sales data solves this by making segmentation precise and bottleneck identification automatic.
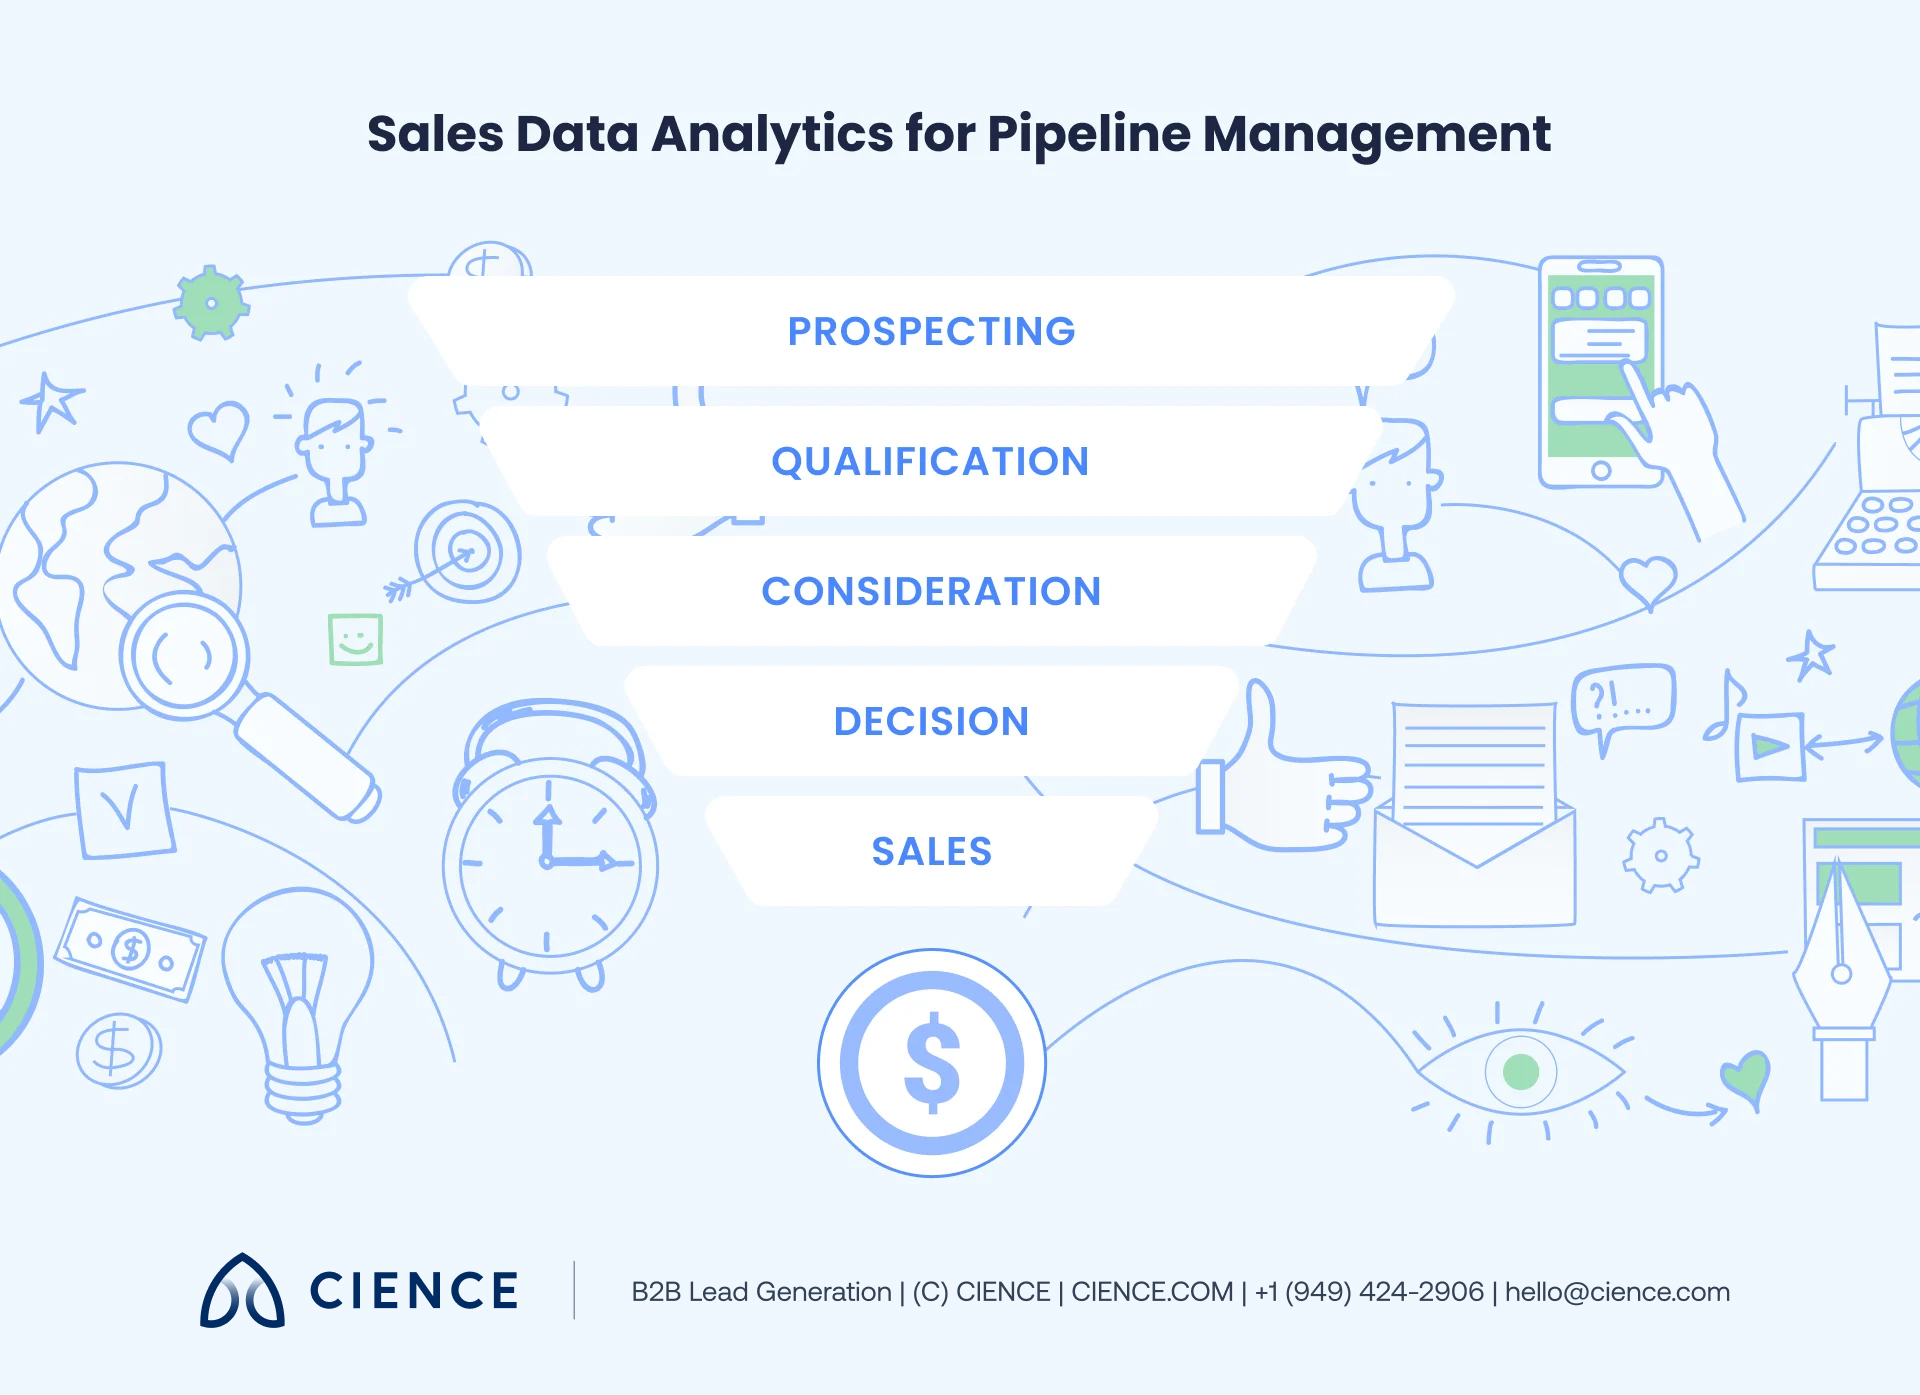
Once you know how to analyze sales data, you can segment pipeline leads by profitability and engagement level, and track how leads move through each stage. That visibility reveals exactly where your team loses deals — whether it’s at discovery, proposal, or negotiation.
Sales data also clarifies the customer journey: which company sizes close fastest, which verticals convert at the highest rate, which sequences drive the most responses. These patterns directly inform your prospecting strategy, pricing approach, and messaging. For middle-market B2B teams, this kind of data-driven pipeline management is what separates predictable revenue from constant scrambling.
Bad data doesn’t just waste budget — it trains your team to accept poor results as normal. Clean intelligence changes everything.
“Over 60% of our sales during our first six months came as a result of CIENCE. You have two choices with these kinds of projects — you can outsource it or bring it in-house. CIENCE is the best of both worlds, combining the cost-saving benefits of outsourcing with the insight and personal relationships that come with in-house employees.” — Casey Griswold, Founder, Armatic
CIENCE + graph8 pricing: $5,000 one-time GTM system setup, $2,499/mo strategic execution, and the graph8 platform at $499/mo. No long-term contracts. See full pricing →
Whether or not you decide to work with us, you’ll walk away with a clear picture of where your pipeline is leaking and what it would take to fix it.
5. Targeted marketing
Targeted marketing is one of the most budget-efficient strategies in B2B because you’re focusing spend on a specific, defined segment instead of broadcasting broadly. The result is higher engagement, better conversion rates, and a faster sales cycle.
A sales analysis report helps you understand your audiences clearly enough to build real target groups — divided by job title, company size, location, vertical, or behavioral signal. You can then use data-driven marketing strategies to reach these segments with messaging that actually resonates.
You can also use current sales data to build lookalike audiences — identifying new prospects who share the firmographic and behavioral profile of your best existing customers. That expands your addressable market without expanding your ICP too broadly.
Make Sales Data Work for Your Pipeline
Sales data analysis turns a reactive pipeline into a proactive growth engine. When your team knows how to collect, interpret, and act on sales data, they stop guessing and start closing.
As this article shows, the five highest-impact applications are: improving retention rates, sharpening forecasting accuracy, strengthening value propositions, tightening pipeline management, and enabling targeted marketing. Each depends on the same foundation: clean, enriched, signal-aware data.
“We worked with the CIENCE team to identify better ways to build lead lists and relax lead constraints. A little bit of lead iteration and finding new approaches to find viable companies helped us to get those 8-10 sign-ups per week.” — Federico Menapace, Head of Technology Partnerships, Segment
Frequently Asked Questions
What types of sales data should B2B companies track?
B2B companies should track four key data types: demographic data (company size, location, maturity stage), technographic data (technology stack and tools used), chronographic data (company changes like funding, acquisitions, or leadership shifts), and intent data (online behavior indicating purchase interest). Together, these data categories give your sales team a complete view of who to target and when.
How does sales data analysis improve customer retention?
Sales data analysis identifies what your best customers value, reveals patterns in churn behavior, and highlights upsell opportunities. The success rate of selling to existing customers is around 70%, compared to just 5-20% for new customers. By analyzing purchase history, engagement patterns, and satisfaction signals, your team can proactively address issues and deliver more relevant offers.
What is the difference between qualitative and quantitative sales forecasting?
Qualitative forecasting relies on expert judgment and historical sales patterns to predict future outcomes, while quantitative methods use mathematical models like time series analysis and causal models. Time series models focus on sales patterns over time, and causal models consider external variables like GDP or market conditions. Most accurate forecasts combine both approaches for a well-rounded prediction.
A graph8 company — AI-powered GTM execution across 250+ B2B industries.
graph8 Platform
From $499/mo
Run your own GTM campaigns with AI-powered data, sequences, and analytics.
Start Free — 2,500 Credits No credit card requiredCIENCE Managed
From $2,499/mo
Our GTM teams build and run your outbound campaigns end-to-end.
15-min call · No commitment2,500+ B2B companies served · Month-to-month contracts · See full pricing →