
The true cost per B2B lead (qualified meeting) averages $1,822 — calculated from $131,158 in annual SDR costs divided by 72 meetings per year. That total includes hiring, OTE salary, tech stack, overhead, and management allocation. Most sales leaders underestimate this number by 40–60% because they only count base salary.
Last Refreshed: March 2026 with updated salary benchmarks, quota attainment data, and tool costs.
The average cost per B2B lead (qualified meeting) is $1,822 when you account for all SDR-related expenses — from the $4,129 hiring cost to the $75,000 OTE salary, tech stack, overhead, and management time totaling $131,158 per year. Understanding this number is critical for any sales leader budgeting pipeline generation.
From David Dulany, Founder, Tenbound (a graph8 company): “Most sales leaders are shocked when they run the full math on in-house SDR costs. The $1,822-per-meeting figure isn’t pessimistic — it’s what you get when you include hiring, ramp time, quota attainment reality, and management overhead. That’s the number you need to beat if you’re seriously evaluating any alternative to in-house.”
In the sales development department of most businesses, there is one number that dominates all others by order of magnitude — the number of meetings set per month — and the associated price per appointment, which some refer to as cost per lead.
So it comes as no surprise that appointment setting prices, or more specifically, the cost to generate a single qualified meeting or sales opportunity, is of great interest to every sales leader.
Let’s take a thorough look at the costs (obvious and hidden) that comprise cost per lead as set by sales representatives in the business. We’ll also cover how this rolls up into customer acquisition cost and what it means for outsourced vs. in-house decisions.
What Is Cost per Lead (CPL) in Marketing?
Cost per lead, or CPL, is the amount of money spent to acquire one new lead from a marketing campaign. CPL helps sales teams measure the cost-effectiveness of their campaigns, and it’s the number that most sales development representative (SDR) quotas are set to. This is the outcome virtually all sales development managers focus on.
Sales Development Background
Building an inside sales organization is not for the faint of heart. And yet there has been a dramatic increase in the number of sales development reps hired — with 64,300+ open SDR vacancies as of this writing. The popularity of this go-to-market role and the SDR teams built across B2B businesses have been undeniable over the last several years.
Other similar roles that may use CPL metrics include:
- Business development representatives (BDRs)
- Account development representatives (ADRs)
- Inside sales representatives (ISRs)
- Market development representatives (MDRs)
Based on this interest, we can confirm that lead generation is going strong — which sets the demand for leads and proves the need to calculate the cost per lead accurately.
How to Calculate the Cost per Lead
Sales development is hard, grinding work that requires a thick skin and discipline. It’s unsurprising that placing, filling, then training for a role that is difficult could also be pretty pricey.
This is one of the reasons that OTE (on-target earnings) becomes so important. These are the bonuses that keep any given SDR motivated and performing optimally in the face of daily challenges — and also why the SDR role is viewed as a training ground for so many other sales roles.
The average SDR tenure is only 1.8 years. When you factor in the fixed costs of placing, filling, and training SDRs for a role that will have them in a productive capacity for barely two years (1.8 yr tenure – 3.2 month ramp up = 1.5 productive years), it places enormous pressure on hiring managers to get things right.
We’ve used Glassdoor salary averages and have deliberately left out management incentives, software, or any other information that is harder to pin down — but if included, these would significantly increase the costs in calculations.
Costs That Go into Cost Per Lead
Here are the average costs to hire a single SDR (it takes, on average, 42 days to fill an open role), train them, then get that person to a productive state:
- Hiring: $4,129 average cost to hire (Society for HR Management)
- Training and Ramp: 3.2 months (Bridge Group SDR Report)
- Base Salary: $47,973 (Glassdoor)
- Full Salary – OTE: $75,000 (Bridge Group SDR Report)
- Technology Stack: $4,581 (InsideSales State of Sales Report)
- Overhead: 25–40% of employee salary (MIT)
Perhaps the easiest way to envision this taking shape is to create a mythical SDR with a budget secured at the start of the year. Taking all costs into account: our mythical SDR role created January 1 would be filled 42 days later (February 11), then hit full ramp by June.
The total cost before full productivity is nearly $17K ($16,922 to be exact). This does not include management time or oversight beyond hiring and training costs that are industry standard averages from reliable sources.
SDR Annual Cost Breakdown
| Phase | Duration | Cost |
|---|---|---|
| Hiring | 42 days | $4,129 |
| Training & Ramp | 3.2 months | $12,793 |
| Pre-Productivity Subtotal | — | $16,922 |
| Full OTE Salary | 12 months | $75,000 |
| Technology Stack | 12 months | $3,827 |
| Overhead (25–40% of salary) | 12 months | $11,993 |
| Management Allocation (25%) | 12 months | $23,416 |
| Grand Total | — | $131,158 |
Cost per Lead Formula
Now armed with our annual cost of an SDR, we can look for an average quota.
If we analyze the 2021 Bridge Group SDR Report (specifically the results SDRs show on average across various industries), we can see that the difference between introductory meetings set (9) and fully qualified opportunities (7) is not that drastic.
The similarity of those two numbers implies the optimal quota for SDRs is somewhere in between (8). At 68% quota attainment (per the same study), we can calculate how many meetings to expect on a monthly basis.
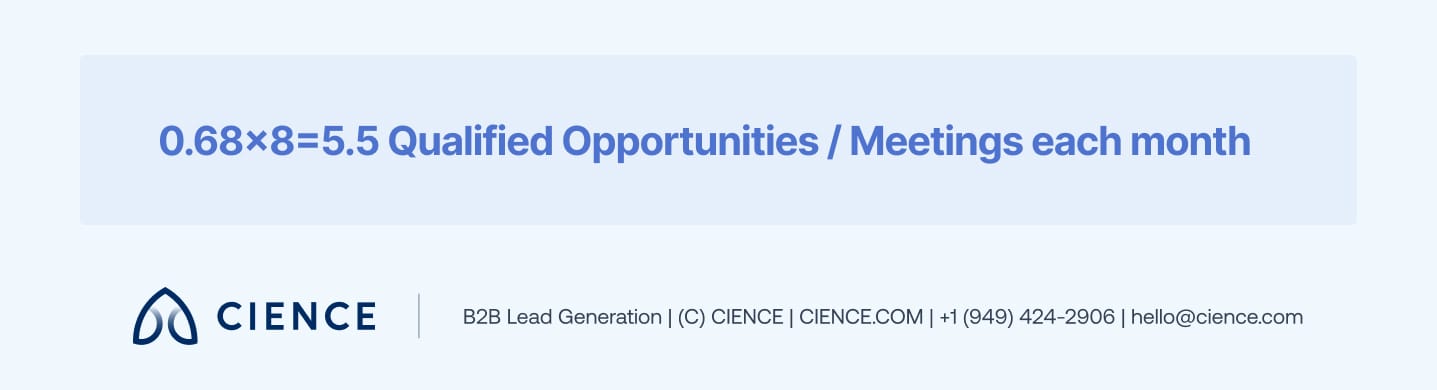
For the sake of easy math, we’ll round to 6 meetings per month — an average of 72 per year. In practice, this number feels about right working across sectors and industries with different target audiences, value propositions, and methods of outreach.
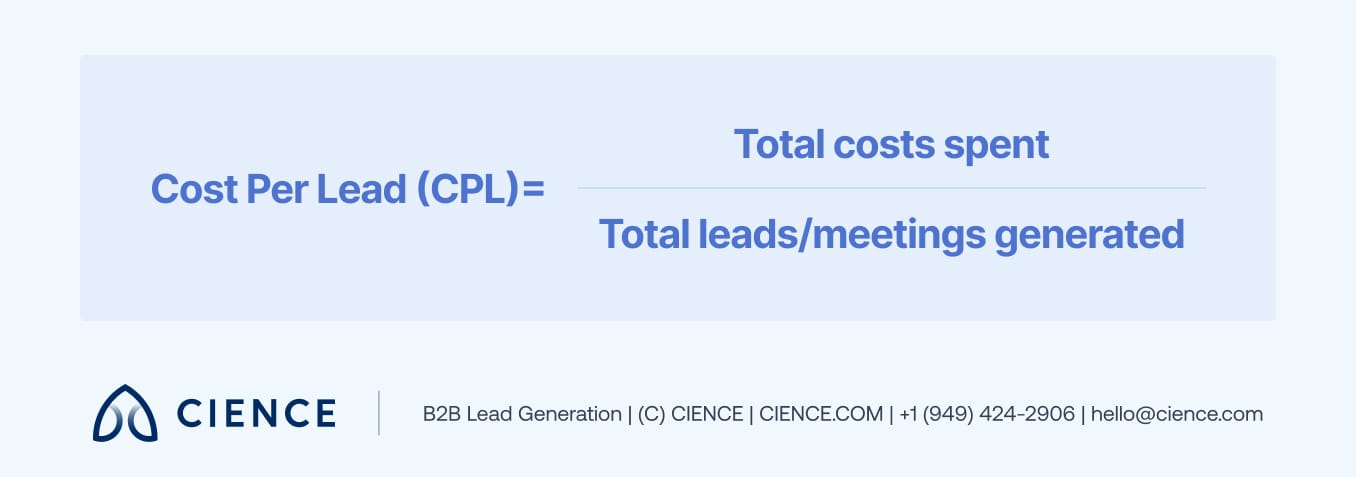
Now that we have the needed components, we can calculate CPL using this formula:
Note: Cost per lead per industry will vary based on the model used, size of accounts targeted, market maturity, and the activity focus of your SDR. The numbers above use averages to demonstrate the complexity of resources that go into producing one converted lead.
Calculating Cost Per Lead
Now that we have all the components of the formula, let’s see how much a lead actually costs.
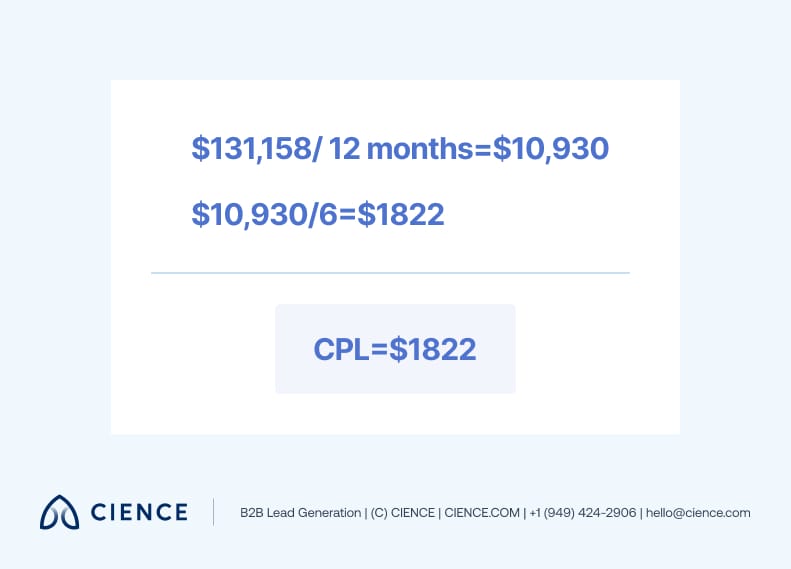
We’ve divided yearly costs spent on SDRs by 12 to find a monthly total. The shorthand: expect to spend approximately $11K per month to get 6 converted meetings. Then divide costs by expected meetings to get CPL — $1,822 per qualified meeting.
You can run your own numbers with the SDR cost calculator or see how this rolls into full funnel economics on the CAC + cost-per-lead guide.
Spending $11K/month for 6 meetings? If your in-house SDR costs keep rising while meetings stay flat, the architecture is the problem — not the people.
Bonus Insight: CPL + CAC
Any marketing or sales leader is intimately familiar with customer acquisition cost. CAC is calculated by dividing all costs spent on acquiring a customer by the number of customers acquired in that period. In a simple example, if a company spent $500K in a year and acquired 50 customers, their CAC is $10,000 per customer.
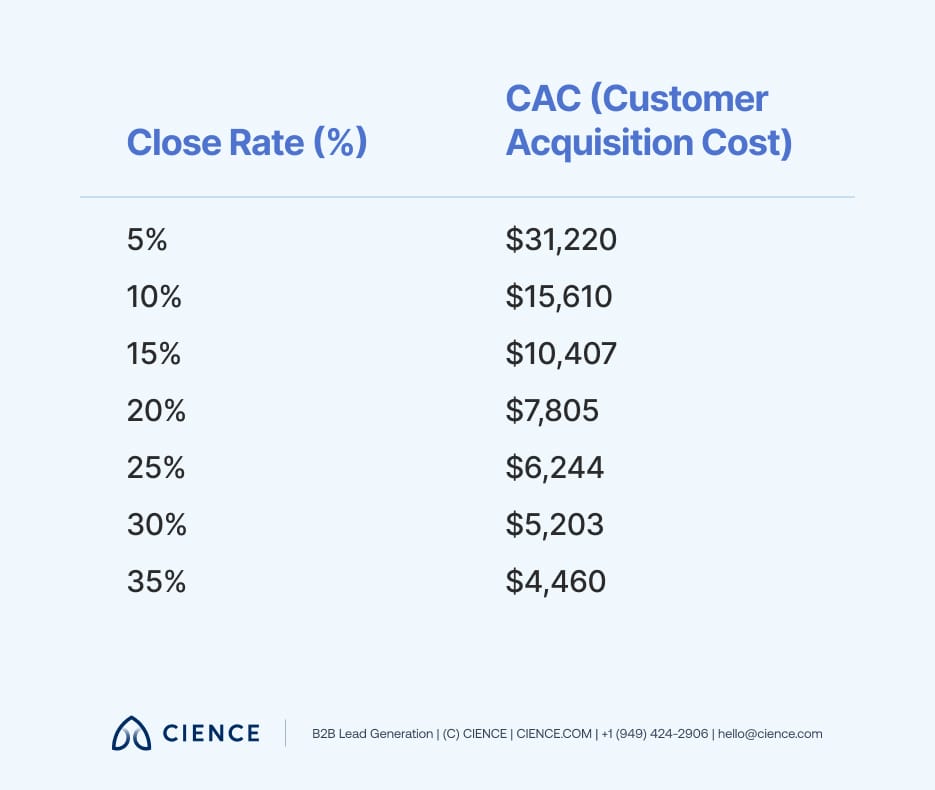
The CPL formula above is vital for outbound-focused organizations to calculate CAC. It also helps find other costs in the sales funnel (especially Account Executives). At a 25% conversion rate from qualified meeting to closed deal, you’d be looking at spending $6,244 — plus AE commissions and other standard sales expenses — to generate a single sale.
Conversion rate matters enormously and is greatly affected by the quality of appointments. The CAC in our scenario has a meaningful range:
This is a handy way to begin thinking through the implications of structuring all aspects of your own sales department.
The slope of conversion rate is quite interesting: once past closing 1 in every 4 deals, there isn’t a dramatic drop in CAC — especially compared to the steep drop moving from 5% to 10% conversion. Getting your sales house in order to ensure a reliable conversion rate is a noble effort that impacts every outbound sales motion, albeit indirectly.
“Stage 1 Financial set 190+ appointments with CIENCE — connecting directly with CEOs and founders at companies that matched their exact ICP. The pipeline was scalable and predictable from month one.” — Stage 1 Financial
What This Means for Your GTM Budget
Lead generation is not going anywhere. Knowledge of the principles of sales development — in the industry and your own company — can become a meaningful competitive advantage.
Understanding the baseline costs inherent to any model is a valuable tool for making wise decisions affecting your go-to-market. The $1,822-per-meeting figure is worth understanding: many parts, all moving, contribute here.
Whether you’re optimizing an in-house SDR team, evaluating outsourced alternatives, or supplementing pipeline with B2B data and programmatic advertising, the math starts with this number.
CIENCE has helped 2,500+ clients across 250+ industries build more predictable pipeline — earning a 4.6/5 rating on Capterra. The clients who get the most value are the ones who understand their true cost-per-meeting before they optimize.
If your cost-per-meeting keeps climbing despite adding tools and reps, the problem isn’t execution — it’s the model.
“We’ve worked with CIENCE for over a year. They consistently find good leads for us and expertly schedule demos.” — Sarah Allen-Short
CIENCE + graph8 pricing: $5,000 one-time GTM system setup, $2,499/mo strategic execution, and the graph8 platform at $499/mo. No long-term contracts. See full pricing →
Whether or not you decide to work with us, you’ll walk away with a clear picture of where your pipeline is leaking and what it would take to fix it.
Frequently Asked Questions
How much does it cost to generate one B2B lead?
The average cost per qualified B2B meeting is $1,822 based on fully loaded SDR costs. This includes hiring ($4,129), training and ramp (3.2 months), base salary ($47,973), OTE ($75,000), tech stack ($4,581), overhead, and management allocation — totaling $131,158 per year divided by approximately 72 meetings annually.
What is the difference between cost per lead and customer acquisition cost?
Cost per lead (CPL) measures the expense to generate a single qualified meeting or opportunity. Customer acquisition cost (CAC) includes CPL plus all downstream costs to close the deal — account executive commissions, sales tools, and other expenses. At a 25% conversion rate from meeting to closed deal, the CAC from SDR-sourced leads is approximately $6,244 before AE costs.
Is it cheaper to outsource lead generation or build an in-house SDR team?
Building an in-house SDR costs approximately $131,158 per year before the rep reaches full productivity, with a $16,922 sunk cost before the first meeting is even set. Outsourcing can eliminate hiring risk, ramp time, and management overhead. The right choice depends on your sales cycle, deal size, and how quickly you need pipeline — outsourcing typically delivers results faster while in-house builds institutional knowledge over time.
A graph8 company — AI-powered GTM execution across 250+ B2B industries.
graph8 Platform
From $499/mo
Run your own GTM campaigns with AI-powered data, sequences, and analytics.
Start Free — 2,500 Credits No credit card requiredCIENCE Managed
From $2,499/mo
Our GTM teams build and run your outbound campaigns end-to-end.
15-min call · No commitment2,500+ B2B companies served · Month-to-month contracts · See full pricing →