The Bridge Group SDR Metrics Report 2021: Post COVID-19 Reality
The year 2020 will forever be remembered for one thing in particular—the COVID-19 pandemic. It has become a tough challenge for businesses all around the world: Unemployment rates have exploded, many countries’ gross domestic products (GDPs) have plummeted, and entire business industries are still fighting for their very survival.
Those businesses that have survived were forced to quickly adapt to the new reality: Change the team structures, build a new daily workflow, switch to complete online mobility, and, of course, try their best to keep the sales conversions coming. As for the last one, this job in our industry was delegated to one special team—the sales development representatives (SDRs) whose optimization and latest trends needed special attention from the CEOs and CFOs.
Recently, The Bridge Group issued their bi-annual Sales Development Metrics and Compensation Research Report for 2021, the definitive “pulse check” in the SDR Industry (surveys running every other year since 2007), and how exactly the coronavirus pandemic affected it. The report includes answers from 406 executives from a broad diversity of B2B companies, 91% of which are headquartered in North America and produce $35M median revenues together with a $55K median average selling price (ASP).
This SDR report is an essential source of information for any C-suite decision-maker wondering what the latest trends in sales development are, how to increase revenue growth in 2021, what SDR metrics to track, and what steps are needed to overcome the consequences of the COVID-19 crisis. Here are key takeaways from the report.
The Latest Trends in Sales Development
Unlike in the previous SDR report published in 2018, this time The Bridge Group decided to factor in not only the raw growth rates but also the revenues of companies to determine their success levels. They marked the top quintile (highest 20%) per revenue band as high-growth and the bottom quintile (lowest 20%) per revenue band as laggard.
The report is divided into six sections, each of which shares the trend on the specific aspect of the sales industry. Here are some great points:
Organizational Structure
This year’s SDR report proves it again—outbound is stronger than ever. Combining the powers of inbound and outbound approaches is the most common and effective sales development motion, used mostly in companies with high ASPs. At the same time, companies with a $50K ASP and lower tend to use inbound-only groups.  Apart from this, with the rise of the company’s revenue, the number of hybrid or specialized groups using both inbound and outbound also increased. Even more, the vast majority of specialized groups of sales teams preferred outbound to inbound (72% outbound, 13% inbound, and 15% both equally).
These stats prove that there is a positive correlation between the company’s revenue and their SDR team organization—the more active one combines outbound with inbound, the higher the profit is, and vice versa.
Another change in the organizational structure of sales teams this year is the sharp increase in the number of remote SDRs, especially in the companies with lower revenues. While in 2018 only 48% of companies reported working with remote sales teams, in 2020, the share increased to 64%. Besides that, every fourth company said that they plan to keep their remote teams permanent even after the COVID-19 pandemic.
Hiring SDRs
In 2020, the average required experience at hire for SDRs hit a low record—only 1.2 years, which is twofold less than it was ten years ago. It is interesting to see the ebb and flow over the last decade, culminating in the lowest experience at entry point ever in the study.
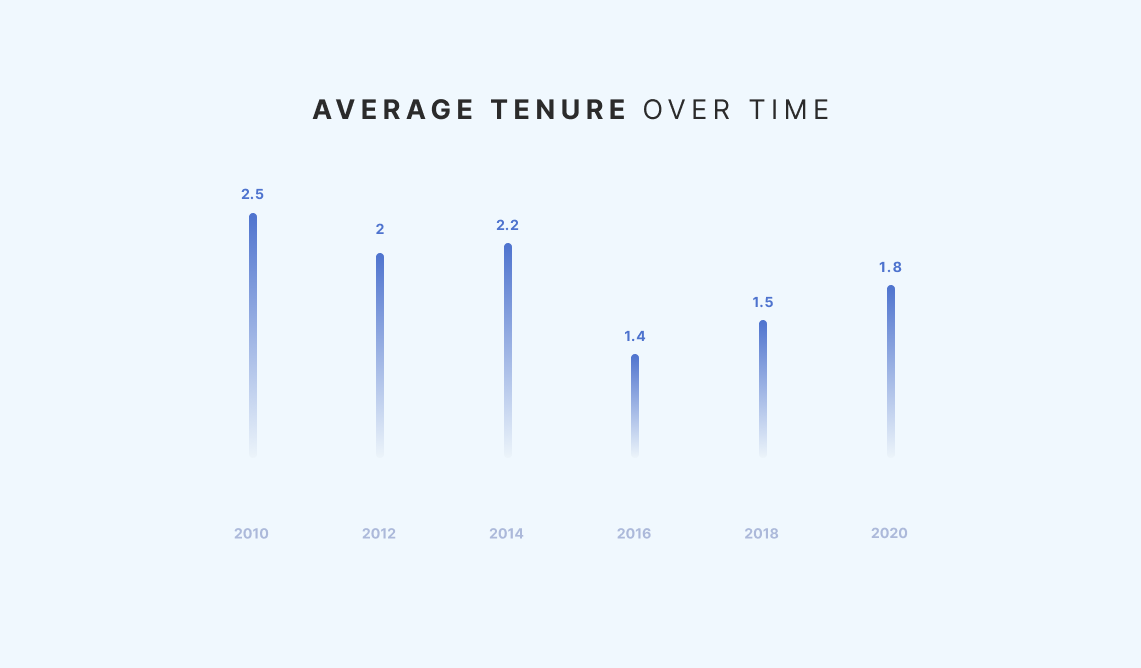
 Contrary to the previous metric, the average tenure of SDRs in 2020 is now increasing and sitting at 1.8 years. This change might be due to: 1) a lack of viable job options to jump to for SDRs during the pandemic; 2) a general tendency of companies to slow down the process of promoting SDRs to account executives due to financial issues during the COVID-19 crisis. The respondents stated that the median time before an SDR is eligible for a promotion is about 17.5 months.
SDR Compensation
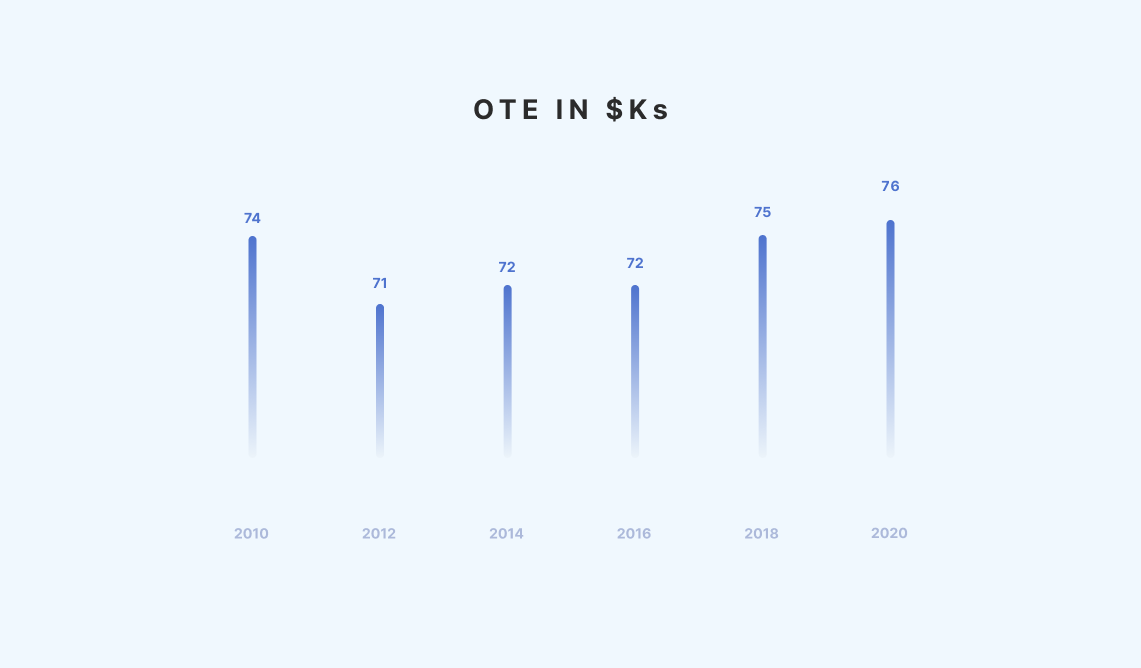
Despite the sudden and unexpected hit of the pandemic, the median on-target earnings (OTEs) of SDRs have stayed stable. Overall, this trend remained flat throughout the decade, which may signal the high and steady demand for sales development representatives.
Also correlated—the fact that SDR compensation is rising while experience at hire is falling suggests that these roles are a top priority for organizations leveraging sales development.
 Sales Technology
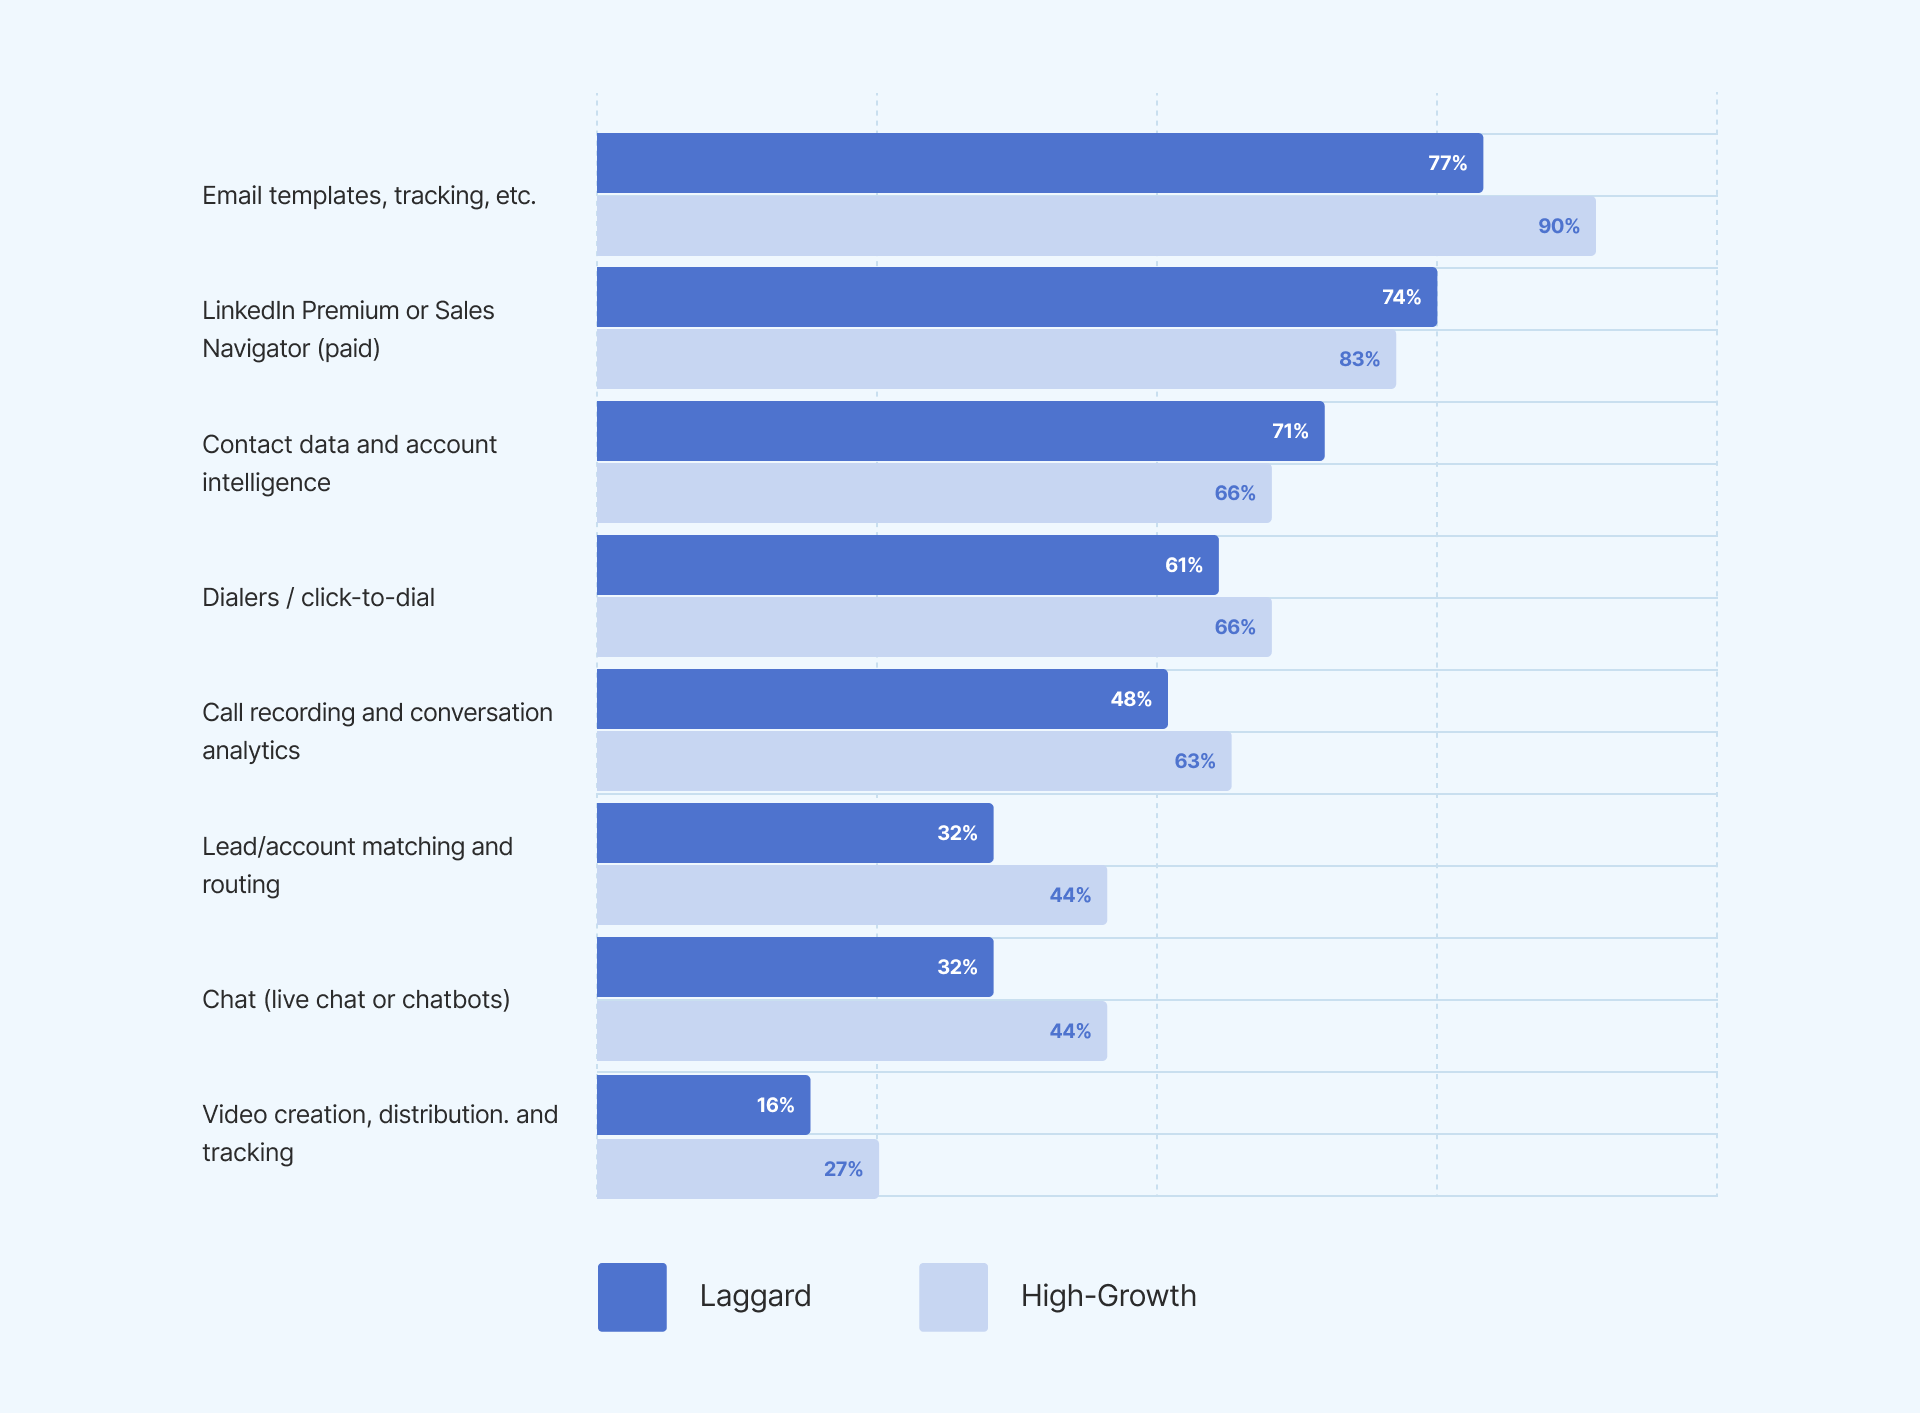
The Bridge Group indicates statistically that to have better revenues, you must have a higher quality of software and technology to optimize—starting with the sales workflow. High-growth companies (as demonstrated in the graph below) almost always deploy more technologies compared with laggard ones. Besides that, 76% of high-growth businesses report that they are active users of sales engagement platforms (SEPs), compared with only 43% of laggard businesses.
SDR Metrics & Quota
Setting up sales KPIs and quotas is quite a challenge—especially if you have no SDR benchmarks for comparison. The exact numbers could differ depending on your business’s industry, company’s size, and SDRs’ capabilities, but knowing how others do it might become a huge help.
Daily Activities
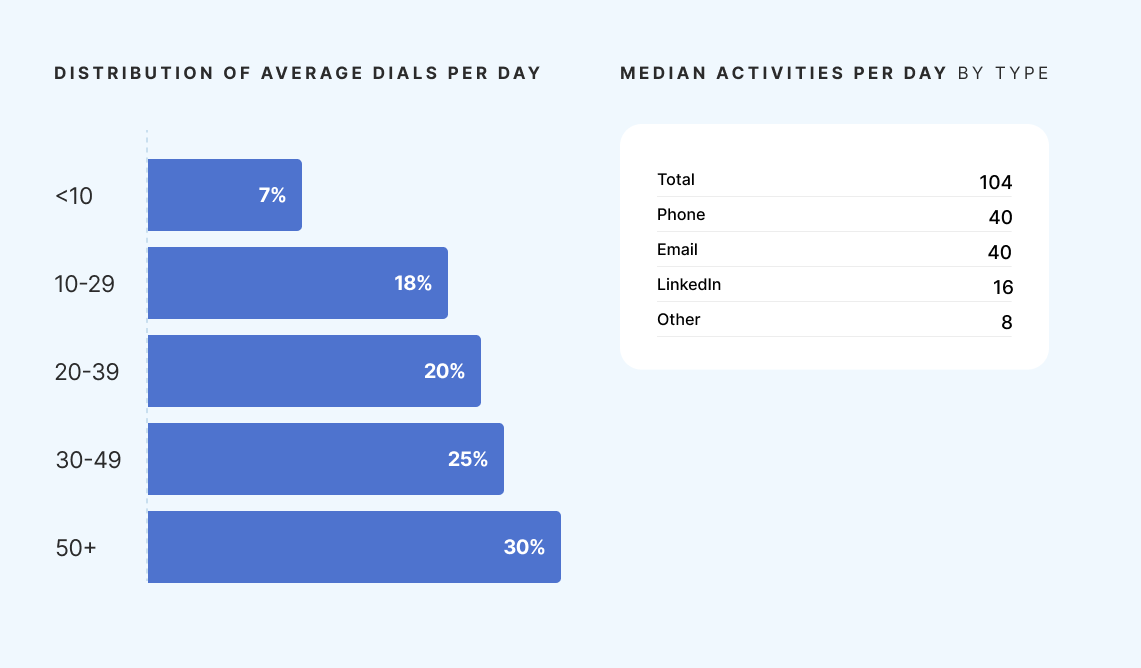
The report states that the majority of SDRs make thirty dials per day. Most activities are connected with phone and email (forty dials per day) while LinkedIn takes only sixteen actions per day. Of course, the coronavirus pandemic and work-from-home routine made their impact on this year’s results. However, the trend line has been declining for the last six years. This may indicate that sales performance, on the flip side, is getting more sophisticated every year.
Consequently, despite the ever-increasing sources of data available on the prospect, reaching out to potential clients gets more and more challenging. The number of attempts an SDR needs to make to reach out to the prospect is on the rise—this year’s average is already at 10.6 tries and growing 8% annually. Interesting fact: The Bridge Group has discovered that groups of SDRs who use phone cold calling techniques as the dominant outreach channel achieve higher quality conversations (QCs) per day compared to other methods.
Achieving the Quotas
Although 2020 was one of the most challenging years for businesses since the 2008 financial crisis, every SDR generated a median of $3.0M in raw pipeline (not “forecast” nor “closed won”). In addition, 68% of sales representatives achieved their quota. However, the number of introductory meetings and qualified opportunities has slightly decreased since the last report was issued.

An important takeaway here is that the bottom-line average of 8.8 introductory meetings and seven fully qualified opportunities per month, an average that is achieved only two-thirds of the time, indicates that many businesses are getting by with effectively one opportunity converted per week, per SDR.
Final Takeaways
There’s no doubt that 2020 was a tough year for most businesses. With the beginning of a lockdown in March 2020, it was quite impossible to predict where the situation would be in almost a year. Despite all of the challenges during COVID-19, most businesses didn’t cut the expenses by giving up their sales software, and the share of the SDRs still met their quotas as they did in 2018.
Overall, B2B sales have done pretty well considering the recent circumstances. However, while some things like the number of appointments per day or sourced pipeline per SDR might change over time, other work practices like remote work, virtual sales, and Zoom meetings with clients and teams are probably here to stay.
A Few (Related) Sales Posts
 Read full post: The Bridge Group 2018 SDR Report’s Must-Know Takeaways for CEOs
The Bridge Group 2018 SDR Report’s Must-Know Takeaways for CEOs
 Read full post: Automated Cold Calling: Using a Progressive Dialer to Boost Sales
Automated Cold Calling: Using a Progressive Dialer to Boost Sales
 Read full post: SDR Outsourcing: Is It Right for My Business?
